
Home › Football › League Cup › Manchester City
Back
Season overview
No league standing for Manchester City in 2026/27.
Match centre



Recent results
Our record: 3 of 4 right


 Man City XI vs Aston Villa: Haaland injury latest, confirmed team news, predicted lineup for Premier LeagueEvening Standard · · Manchester City, Aston Villa
 Will Erling Haaland start against Aston Villa? Latest Man City team news after fitness updateEvening Standard · · Aston Villa, Manchester City Man City punishment fear as furious Premier League clubs might not get their wayMirror Football · · Manchester City
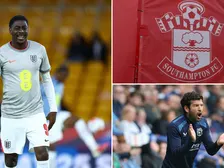
 Man City won't be happy with Southampton situation - Cardiff City must reactFootball League World · · Manchester City, Southampton, Cardiff
Recent form
Last 5 matches in all competitions · latest on the right.
Top scorers
League Cup| PLAYER | G | A | P |
|---|---|---|---|
| 2 | 0 | 1 | |
| 1 | 1 | 1 | |
| 1 | 0 | 1 |
Fixtures
2 matches in the next 7 daysResults
12 matches · all competitions · 2026/27


Our record on Manchester City: 3 of 4 right. The full record ›
League Cup
League page ›No league table available for this season.
Goals
Assists
Yellow cards
No player statistics available for this season.
Red cards
No player statistics available for this season.
Shots on target
Shots
Successful dribbles
Tackles
Interceptions
Blocks
Penalties conceded
No player statistics available for this season.
Save percentage
No player statistics available for this season.
Saves
No player statistics available for this season.
Goals conceded · goalkeepers
| PLAYER | TOTAL |
|---|---|
| 0 |
Fouls committed
Fouls won
Penalties scored
No player statistics available for this season.
Player season statistics
| PLAYER | P | MIN | G | A |
|---|---|---|---|---|
 G. DonnarummaGoalkeeper | 0 | 0 | 0 | 0 |
 G. RulliGoalkeeper | 1 | 90 | 0 | 0 |
 A. KhusanovDefender | 1 | 90 | 0 | 0 |
 K. BraithwaiteDefender | 1 | 19 | 0 | 0 |
 M. GuéhiDefender | 0 | 0 | 0 | 0 |
 N. O'ReillyDefender | 1 | 90 | 0 | 1 |
 R. LewisDefender | 1 | 90 | 0 | 0 |
 Vitor NunesDefender | 1 | 90 | 0 | 0 |
 A. BouaddiMidfielder | 1 | 90 | 0 | 1 |
 AllanMidfielder | 1 | 71 | 1 | 1 |
 E. AndersonMidfielder | 0 | 0 | 0 | 0 |
 E. FernándezMidfielder | 0 | 0 | 0 | 0 |
 M. KovačićMidfielder | 1 | 90 | 0 | 0 |
 Matheus NunesMidfielder | 0 | 0 | 0 | 0 |
 R. Aït-NouriMidfielder | 1 | 90 | 0 | 2 |
 R. CherkiMidfielder | 1 | 45 | 1 | 0 |
 A. SemenyoAttacker | 0 | 0 | 0 | 0 |
F. SambaAttacker | 1 | 90 | 2 | 0 |
 I. NdiayeAttacker | 0 | 0 | 0 | 0 |
 R. McAidooAttacker | 1 | 45 | 1 | 0 |
Manchester City in League Cup, 2026/27. This may include players who have since left. Updated 22 Oct. A dash means no figure is available.
League Cup matches only · 2026/27 · 1 match · through 17 Sept
Season record
- Played
- 1
- Wins
- 1
- Draws
- 0
- Losses
- 0
- Points
- 3
- Win rate (%)
- 100.0
Goals
- Goals scored
- 5
- Goals conceded
- 0
- Goal difference
- +5
- Scored per match
- 5.0
- Conceded per match
- 0.0
Scoring patterns
- Clean sheets
- 1
- Failed to score
- 0
- Both teams scored (%)
- 0.0
- Over 1.5 goals (%)
- 100.0
- Over 2.5 goals (%)
- 100.0
- Over 3.5 goals (%)
- 100.0
Results & runs
- Longest winning run
- 1
- Longest drawing run
- 0
- Longest losing run
- 0
- Biggest win
- 5–0
- Biggest loss
- –
Goals by half
- Matches with half-time scores
- 1
- First-half goals scored
- 2
- First-half goals conceded
- 0
- Second-half goals scored
- 3
- Second-half goals conceded
- 0
Shooting & saves
Per match
- Total shots1/1 matches
- 14.0
- Shots on target1/1 matches
- 6.0
- Shots off target1/1 matches
- 5.0
- Blocked shots1/1 matches
- 3.0
- Shots inside the box1/1 matches
- 12.0
- Shots outside the box1/1 matches
- 2.0
- Expected goals (xG)0/1 matches
- –
- Goalkeeper saves1/1 matches
- 0.0
Possession & passing
Per match · pass accuracy across all passes
- Possession (%)1/1 matches
- 63.0
- Total passes1/1 matches
- 759.0
- Accurate passes1/1 matches
- 707.0
- Pass accuracy (%)1/1 matches
- 93.1
Set pieces
Per match
- Corners1/1 matches
- 2.0
- Offsides1/1 matches
- 1.0
Discipline
Totals, and averages per match we hold data for
- Fouls per covered match1/1 matches
- 8.0
- Yellow cards1/1 matches
- 0
- Yellow cards per covered match1/1 matches
- 0.0
- Red cards1/1 matches
- 0
- Red cards per covered match1/1 matches
- 0.0
Penalties
Recorded penalty outcomes
- Taken1/1 matches
- 0
- Scored1/1 matches
- 0
- Missed1/1 matches
- 0
- Conversion (%)1/1 matches
- –
Goals scored by minute
Stoppage time included in each half
- 0–15′1/1 matches
- 0
- 16–30′1/1 matches
- 1
- 31–45′+1/1 matches
- 1
- 46–60′1/1 matches
- 2
- 61–75′1/1 matches
- 0
- 76–90′+1/1 matches
- 1
Goals conceded by minute
Stoppage time included in each half
- 0–15′1/1 matches
- 0
- 16–30′1/1 matches
- 0
- 31–45′+1/1 matches
- 0
- 46–60′1/1 matches
- 0
- 61–75′1/1 matches
- 0
- 76–90′+1/1 matches
- 0
Recent form
League Cup only · latest on the right
- Norwich17 Sept · Home
- 5–0
Formations used
Known in 1 of 1 matches
- 4-2-3-1
- 1 match
Based on match-by-match figures, which may cover fewer matches than the official table. Each detailed measure shows its sample. A dash means no figure is available.
League Cup matches only · 2026/27 · 1 home match · through 17 Sept
Season record
- Played
- 1
- Wins
- 1
- Draws
- 0
- Losses
- 0
- Points
- 3
- Win rate (%)
- 100.0
Goals
- Goals scored
- 5
- Goals conceded
- 0
- Goal difference
- +5
- Scored per match
- 5.0
- Conceded per match
- 0.0
Scoring patterns
- Clean sheets
- 1
- Failed to score
- 0
- Both teams scored (%)
- 0.0
- Over 1.5 goals (%)
- 100.0
- Over 2.5 goals (%)
- 100.0
- Over 3.5 goals (%)
- 100.0
Results & runs
- Longest winning run
- 1
- Longest drawing run
- 0
- Longest losing run
- 0
- Biggest win
- 5–0
- Biggest loss
- –
Goals by half
- Matches with half-time scores
- 1
- First-half goals scored
- 2
- First-half goals conceded
- 0
- Second-half goals scored
- 3
- Second-half goals conceded
- 0
Shooting & saves
Per match
- Total shots1/1 matches
- 14.0
- Shots on target1/1 matches
- 6.0
- Shots off target1/1 matches
- 5.0
- Blocked shots1/1 matches
- 3.0
- Shots inside the box1/1 matches
- 12.0
- Shots outside the box1/1 matches
- 2.0
- Expected goals (xG)0/1 matches
- –
- Goalkeeper saves1/1 matches
- 0.0
Possession & passing
Per match · pass accuracy across all passes
- Possession (%)1/1 matches
- 63.0
- Total passes1/1 matches
- 759.0
- Accurate passes1/1 matches
- 707.0
- Pass accuracy (%)1/1 matches
- 93.1
Set pieces
Per match
- Corners1/1 matches
- 2.0
- Offsides1/1 matches
- 1.0
Discipline
Totals, and averages per match we hold data for
- Fouls per covered match1/1 matches
- 8.0
- Yellow cards1/1 matches
- 0
- Yellow cards per covered match1/1 matches
- 0.0
- Red cards1/1 matches
- 0
- Red cards per covered match1/1 matches
- 0.0
Penalties
Recorded penalty outcomes
- Taken1/1 matches
- 0
- Scored1/1 matches
- 0
- Missed1/1 matches
- 0
- Conversion (%)1/1 matches
- –
Goals scored by minute
Stoppage time included in each half
- 0–15′1/1 matches
- 0
- 16–30′1/1 matches
- 1
- 31–45′+1/1 matches
- 1
- 46–60′1/1 matches
- 2
- 61–75′1/1 matches
- 0
- 76–90′+1/1 matches
- 1
Goals conceded by minute
Stoppage time included in each half
- 0–15′1/1 matches
- 0
- 16–30′1/1 matches
- 0
- 31–45′+1/1 matches
- 0
- 46–60′1/1 matches
- 0
- 61–75′1/1 matches
- 0
- 76–90′+1/1 matches
- 0
Recent form
League Cup only · latest on the right
- Norwich17 Sept · Home
- 5–0
Formations used
Known in 1 of 1 matches
- 4-2-3-1
- 1 match
Based on match-by-match figures, which may cover fewer matches than the official table. Each detailed measure shows its sample. A dash means no figure is available.
League Cup matches only · 2026/27 · 0 away matches
Season record
- Played
- 0
- Wins
- –
- Draws
- –
- Losses
- –
- Points
- –
- Win rate (%)
- –
Goals
- Goals scored
- –
- Goals conceded
- –
- Goal difference
- –
- Scored per match
- –
- Conceded per match
- –
Scoring patterns
- Clean sheets
- –
- Failed to score
- –
- Both teams scored (%)
- –
- Over 1.5 goals (%)
- –
- Over 2.5 goals (%)
- –
- Over 3.5 goals (%)
- –
Results & runs
- Longest winning run
- –
- Longest drawing run
- –
- Longest losing run
- –
- Biggest win
- –
- Biggest loss
- –
Goals by half
- Matches with half-time scores
- 0
- First-half goals scored
- –
- First-half goals conceded
- –
- Second-half goals scored
- –
- Second-half goals conceded
- –
Shooting & saves
Per match
- Total shots0/0 matches
- –
- Shots on target0/0 matches
- –
- Shots off target0/0 matches
- –
- Blocked shots0/0 matches
- –
- Shots inside the box0/0 matches
- –
- Shots outside the box0/0 matches
- –
- Expected goals (xG)0/0 matches
- –
- Goalkeeper saves0/0 matches
- –
Possession & passing
Per match · pass accuracy across all passes
- Possession (%)0/0 matches
- –
- Total passes0/0 matches
- –
- Accurate passes0/0 matches
- –
- Pass accuracy (%)0/0 matches
- –
Set pieces
Per match
- Corners0/0 matches
- –
- Offsides0/0 matches
- –
Discipline
Totals, and averages per match we hold data for
- Fouls per covered match0/0 matches
- –
- Yellow cards0/0 matches
- –
- Yellow cards per covered match0/0 matches
- –
- Red cards0/0 matches
- –
- Red cards per covered match0/0 matches
- –
Penalties
Recorded penalty outcomes
- Taken0/0 matches
- –
- Scored0/0 matches
- –
- Missed0/0 matches
- –
- Conversion (%)0/0 matches
- –
Goals scored by minute
Stoppage time included in each half
- 0–15′0/0 matches
- –
- 16–30′0/0 matches
- –
- 31–45′+0/0 matches
- –
- 46–60′0/0 matches
- –
- 61–75′0/0 matches
- –
- 76–90′+0/0 matches
- –
Goals conceded by minute
Stoppage time included in each half
- 0–15′0/0 matches
- –
- 16–30′0/0 matches
- –
- 31–45′+0/0 matches
- –
- 46–60′0/0 matches
- –
- 61–75′0/0 matches
- –
- 76–90′+0/0 matches
- –
Recent form
No matches for this selection.
Formations used
Known in 0 of 0 matches
No formation figures for this selection.
Based on match-by-match figures, which may cover fewer matches than the official table. Each detailed measure shows its sample. A dash means no figure is available.